Everything you need to know about the expanding triangle pattern in trading

Technical indicators are an integral part of the trading experience. However, they can sometimes be a double-edged sword – overcomplicating charts and causing disorientation, rather than clarity.
One of such complex indicators in the expanding triangle pattern, which consists of a series of higher highs and lower lows, resulting in a widening price range.
When this indicator is formed, this typically shows a high degree of volatility on the market, as well as indecision in the immediate price action – potentially suggesting a trend breakout on the horizon.
The pattern is often used in stock and FX scalping strategies and is characterized by an increasing volume of trades, where bullish and bearish pressures are trying to take over.
Understanding the expanding triangle pattern can help you identify trend changes on the market and take advantage of the trading opportunities that come with them.
What is the expanding triangle pattern?
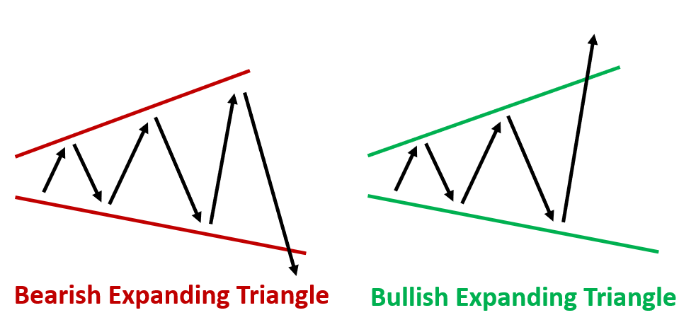
The expanding triangle pattern is a technical indicator that is commonly observed in stock trading. The pattern can be observed when a series of higher highs and lower lows are formed on a price chart, widening the price range as a result.
The pattern is most often used in stock trading and consists of multiple individual parts:
- Ascending trendline – the ascending trendline connects the higher lows in the price, indicating upward price movements
- Descending trendline – the descending trendline connects the lower highs in the price, indicating downward price movements
- Widening range – the expanding triangle is characterized by a widening or broadening range, as reflected in the increasing distance between the ascending and descending trendlines
- Higher highs and lower lows – The price alternates between reaching higher highs and lower lows within the expanding triangle, creating a pattern resembling a triangle
- Breakout points – Breakouts can occur when the price breaches either the upper or lower trendline, indicating a potential shift in trend direction
It is important to note that the expanding triangle pattern does not indicate where the price will go in the future. Rather, it shows how market conditions change as volatility spikes, which in turn can indicate trend breakdowns and breakouts.
What the expanding triangle pattern indicates
The expanding triangle pattern indicates a rise in volatility and uncertainty on the market, where both bullish and bearish price action are failing to tilt the price to their favor.
There are two types of triangle patterns – bullish and bearish. A bullish triangle pattern occurs when the triangle pattern finally breaks out into an upward price movement, and vice versa.
The triangle pattern has a few distinctive applications in trading, such as:
- Identify trend reversals and continuations – A breakout from the expanding triangle may signal a potential trend reversal or continuation, depending on the direction of the breakout
- Confirm breakouts – Traders often wait for a confirmed breakout, requiring the price to breach the upper or lower trendline with increased volume
- Entry and exit points – Long positions can be placed if the price breaks above the triangle pattern, while short positions can be placed if the price breaks below the pattern
- Pattern within a pattern – Micro-patterns may become visible within a triangle pattern, which can give a better indication of the possible direction of the price
Using the expanding triangle pattern alongside the RSI or MACD gives traders a better understanding of when and at what points a price breakout may happen, which can pinpoint profitable opportunities on the chart traders can structure their strategies around.
Limitations of the expanding triangle pattern
While the expanding triangle pattern shows a volatility spike on a price chart, it does not at all indicate the direction of the price action. Therefore, the pattern cannot be interpreted as either a bullish or bearish indicator.
For this reason, the pattern can be unreliable as a trading signal and other technical indicators are usually deployed to give the pattern more weight so it actually indicates a bullish/bearish signal.
One such indicator is the Relative Strength Index, which measures the strength of a trend and is used to generate overbought and oversold signals, adds a layer to the indicator and shows clearer buy and sell signals.
For example, when an expanding triangle pattern forms and the RSI shows an oversold signal, traders may interpret this as a buy signal, and vice versa.
Example of the expanding triangle pattern
To better understand how the expanding triangle pattern works in practice, we can look at an example of the pattern on a TradingView price chart:
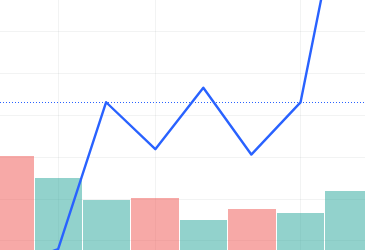
Here we can see a brief triangle pattern that shows conflicting buying and selling pressures, resulting in triangle shapes, which break out into a bullish run.
When the RSI is plotted below the price chart, it can show a value of 0 to 100. As the RSI falls, an oversold signal is generated and traders can open long positions. Conversely, is the value rises and raches 70 or above, this is considered as overbought and short positions are more adequate.
Such patterns can be observed on the price charts of various instruments. However, they are especially popular among stock traders, as line charts are most often used during stock trading, when viewing price data over longer periods of time.
FAQ on the expanding triangle pattern
How reliable is the expanding triangle pattern?
While the expanding triangle pattern signals market volatility, it does not give a clear indication of where the market could be heading next.
For this reason, it is important to not rely only on the triangle pattern and to use other indicators in conjunction.
When does the expanding triangle pattern form?
The expanding triangle pattern forms during periods of high volatility and uncertainty. The pattern arises when conflicting forces cause the price to oscillate between higher highs and lower lows, leading to a widening pattern.
Traders may interpret the pattern as an upcoming trend shift and use other indicators to identify whether the new trend will be bullish or bearish.
Is the expanding triangle a bullish pattern?
The expanding triangle pattern is not inherently bullish or bearish. It signals increased market volatility and uncertainty, with a widening price range. Traders typically await a breakout to determine the likely direction of the trend.
Due to the uncertain direction of the pattern, it is important to use it alongside other technical indicators, such as the RSI or the MACD.










Comments (0 comment(s))