Understanding Doji candles – Everything that you should know
Table of contents
A Doji in trading refers to a session in which the candlestick for a certain trading asset has the same open and close price. If you look at the candlestick chart, you might notice that in addition to regular candles, the price movements are sometimes also shown as crosses. These crosses are called Doji candles.
In most cases, a Doji forms when the open and close price of the asset is the same. It typically signals that a reversal is coming, however, it can have other meanings as well.
In total, the Doji candle has as many as five variations, and not all of them indicate the same thing. Because there are several meanings that a Doji can have, it is crucial for traders to understand how it really works. So, if you want to learn more about Doji candlestick meaning, follow our comprehensive guide and see how you can use it for the best outcome.
Understanding Doji candles
Before you can understand the meaning behind the Doji candle, you should know what candlestick charts are. Technical analysts frequently use different types of charts to analyze the market. The candlestick chart is probably one of the most used charts in the market.
It was developed in Japan many years ago and became very popular in the western world a few decades back. The candlestick shows traders four different prices. Based on the shape of the candle, traders are able to make assumptions about the price behavior.
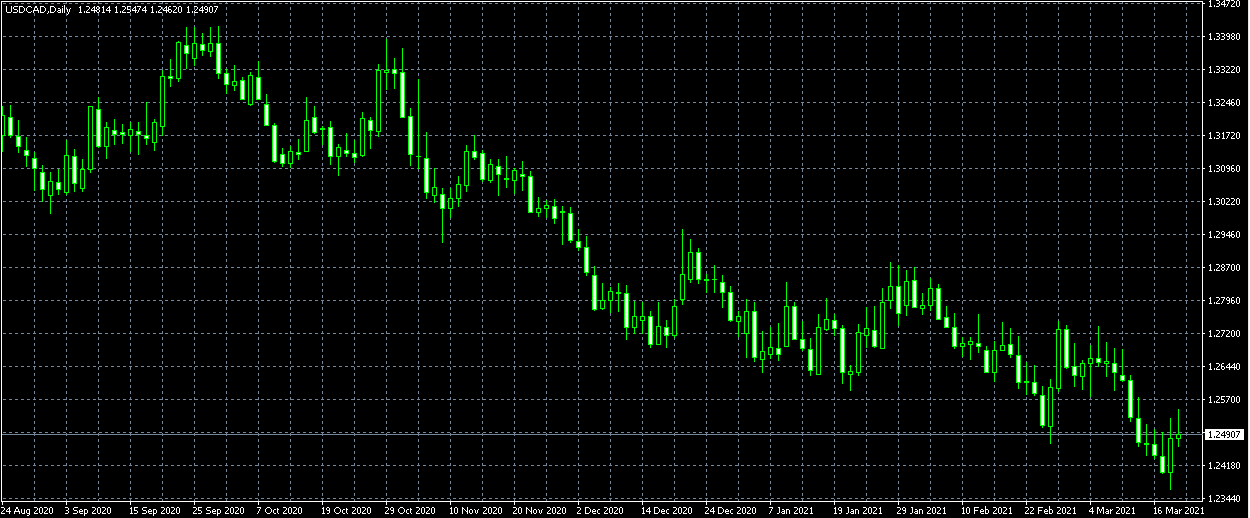
According to the open, high, low, and close price of the asset, each of the candles looks differently. The candle has a body, which shows the open and close price of the asset. Also, there are lines coming out from the top and bottom of the body, which are referred to as shadows and shows the high and low of the day. For example, below, you can see a candlestick chart of USD/CAD which shows price movements of the currency pair from August 24, 2020 to March 16, 2021. The chart is taken from MetaTrader 4, which is a very popular trading platform.
As we have already mentioned, a Doji is created when the open and close price of the asset is virtually the same.
In the chart, a Doji looks like a cross or a plus sign and does not have a body. There are some experts who say that the Doji indicates the indecision of the traders, which results in the price staying the same. On the other hand, there are others who see it as a sign of reversal. A Doji can be a very important part of the chart, as it can help analysts identify potential price movements.
Doji candlestick pattern types
Depending on where the open and close line falls, you might come across different types of Doji candles. The most popular ones are gravestone, long-legged, and dragonfly. Understanding the differences between these three might be very helpful for traders. Below, we will discuss each of these one-by-one.
Gravestone Doji candlestick – How does it work?
Gravestone Doji is many times referred to as a bearish Doji candle because it mostly indicates a bearish reversal. It is formed when the open, low, and closing prices are all near each other and it has a long upper shadow. Technical analysts see gravestone Doji as a sign that although the asset had a bullish advance at the beginning of the session, it was quickly overcome by a bearish trend. In most cases, it comes before a longer bearish downtrend.
It is possible for the gravestone Doji to be found at the end of the downtrend, however, in most cases, it is found at the end of an uptrend. In most cases, traders prefer to not act on a Gravestone Doji, at least before another candle provides confirmation for the reversal. Traders are advised to use other indicators to make sure that they are making the right moves.
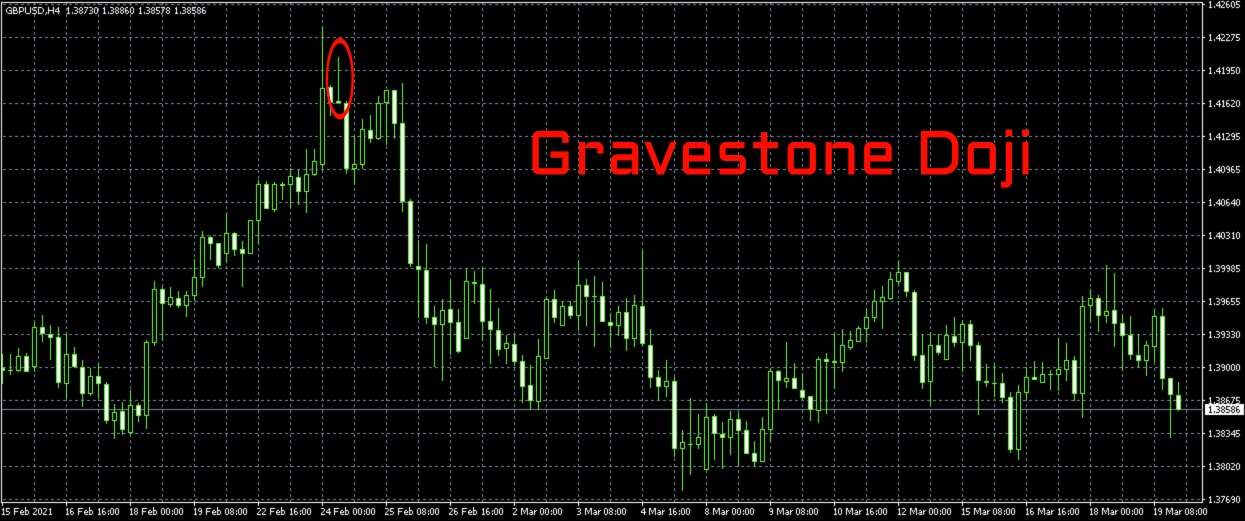
Below, you can see the GBP/USD candlestick chart, where the Gravestone Doji is in a red circle. As you can see, Gravestone Doji was followed by a trend reversal.
Doji candle indicator – Long-legged
The long-legged Doji can be seen very frequently on the candlestick chart. It consists of long upper and lower shadows. This type of Doji candle patterns mostly refer to indecision about the direction of the market. Some analysts say that it indicates that there is indecision after a strong downtrend, which might end up with an upside move.
Long-legged Doji is the most significant when it occurs during a strong uptrend or downtrend. It indicates that a strong reversal might occur soon. It is neither bullish nor bearish, as it simply shows that a change might be happening. It simply shows that the price is no longer pushing towards the direction it was. Although it can be found across any timeframe, experts say that it is more significant on longer-term charts.
Doji candle types – Dragonfly
This type of Doji also signals a potential reversal of the price. It is formed when the high, open, and close price of the asset is the same. If the lower shadow is longer, it can be said that the selling was very aggressive, however, since the open and close prices were the same, it can indicate that the buyers were able to increase the demand to push the price back up.
After a downtrend, it is a sign that the price will increase, at the end of an uptrend, it indicates that the price might be decreasing. No matter what is the case, Dragonfly Doji requires confirmation.
So, if there is a Dragonfly Doji candle bearish potential, it needs to be confirmed by the following candle. The following candle needs to drop and close below the close of the dragonfly candle. However, if the confirmation candle increases the price, it means that the reversal signal was invalid and the price might continue rising.
On the other hand, if the dragonfly Doji showed that the price was going to increase and the next candle confirms the movement, it means that you were dealing with a bullish Doji candle and the signal was correct.
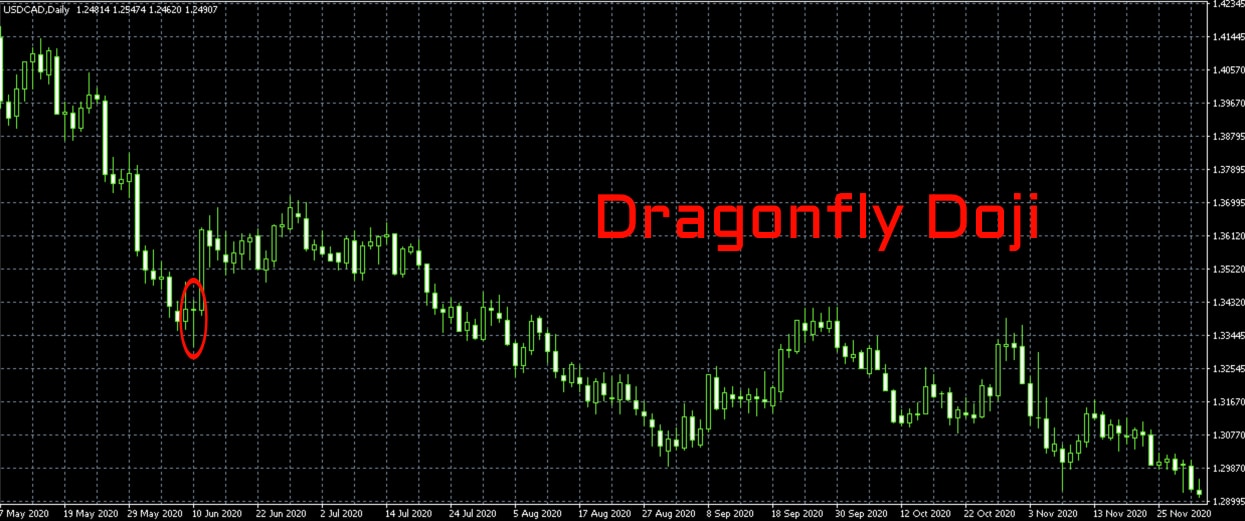
Below, you can see a candlestick chart of USD/CAD. On the chart, you can see a dragonfly Doji in a circle. As you can tell, the dragonfly Doji candle was followed by a reversal. The chart is from MT4 trading software, which is offered by most of the brokers online.
Advantages of Doji candlestick chart pattern
The Doji candle, or sometimes referred to as the Doji star, can be a significant tool for technical analysis. If the market is having an upward trend and the Doji candlestick pattern appears, it could be a sign that the momentum is slowing down. Traders might use it as a sign to exit the long position.
However, it should be noted that it is very important for traders to look out for the candle confirmation and use it with other technical indicators. You should follow the Doji candle indicator if you are confident that it gives you enough information to make moves.
Forex Doji candle can be a very important part of your technical analysis since it provides you with very important information. If you see a red Doji candle after an uptrend, it means that the prices might start decreasing, while the green Doji candle could be a sign that the market is taking an uptrend.
However, every trader should keep in mind that Doji candles have to be confirmed by the following candle. It is also a great idea to use different types of indicators in addition to the Doji candles to boost your confidence and make sure that you are doing the right thing.
Doji candles explained – Disadvantages
Much like anything else in this market, there are some downsides associated with Doji candles as well. If you decide to use a Doji candle and don’t follow any other indicator, it might act as a neutral indicator that provides very little information about the market.
Another very important thing is that it does not occur that frequently, which means that it might be a little harder to use it as a reliable tool to spot price reversals. When it does occur, it does not mean that it will help you make accurate decisions either. This is why so many traders prefer to use Doji with other indicators.
Doji candle chart – Other types of it
Earlier, we have discussed the most prominent and popular types of Doji candlestick. However, there might be others that you can come across while trading. Before we go any further, we should also note that it is very hard to find a perfect Doji while trading. In most cases, traders look for candles that resemble Doji patterns as closely as possible. In most cases, you will notice that they still have tiny bodies.
One of the types of Doji patterns that we have not discussed earlier is the standard Doji. It is a candle that does not really show much information on its own. To better understand how it might work, traders frequently look at the previous price movements. For example, if you spot a standard Doji during an uptrend, it might be a sign that the uptrend will continue.
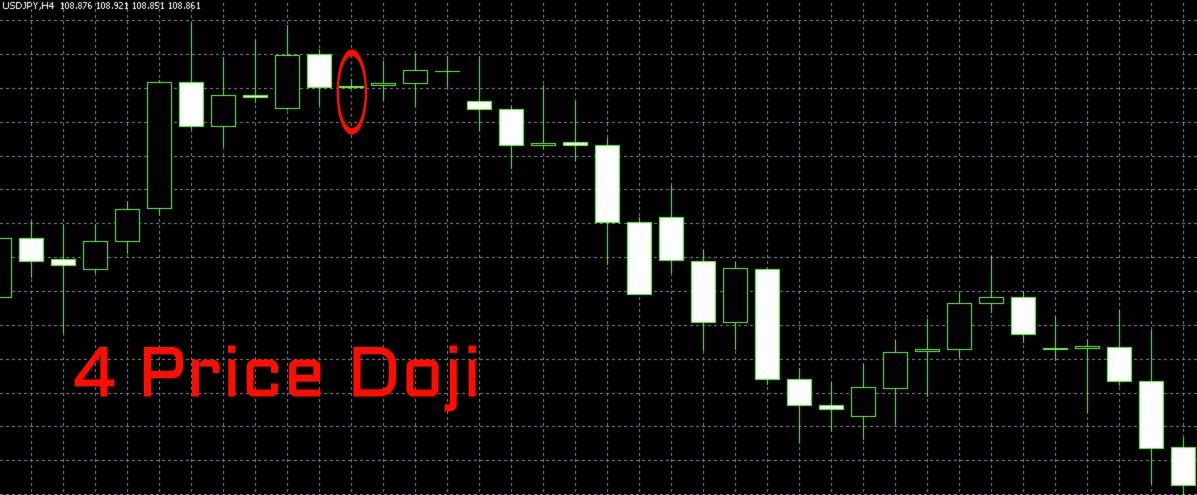
There also is a very interesting type of Doji, called the 4 Price Doji. It simply is a horizontal line that has no vertical line above or below it. This is a unique type of Doji, largely showing the indecision in the market. Below, on a USD/JPY candlestick chart, you can see 4 Price Doji in a red circle.
Final thoughts on Doji candle Forex
Doji candles can play a huge role in technical analysis. In trading, Doji is a name that describes a session in which the open and close price of a certain trading asset was the same. In most cases, Doji candles look like a cross, while different types of it might look like an inverted cross, a plus, or even a letter ‘T’.
Alone, Doji candles represent neutral patterns, however, paired with other technical indicators, they can be a great help. Generally, Doji signals a reversal pattern for technical analysis. There are three major types that the Doji forms, they are gravestone, long-legged, and dragonfly. The type of Doji largely depends on where the open and close line of the asset falls.
Because Doji candles can provide different types of information about the market, it is very important for traders to understand how exactly they work. Most traders prefer to use Doji candles with other technical indicators to increase their confidence in their positions.


Comments (0 comment(s))