How Forex Traders Can Utilize Heiken Ashi Charts?
Table of contents
When it comes to the technical analysis in Forex trading, many market participants look at candlestick patterns to determine the overall direction of the trend. However, the fact of the matter is that remembering and identifying all those types of patterns can be a challenging task for many traders.
Fortunately, one way to remedy this situation is to use Heiken Ashi charts. Those types of diagrams have been designed in Japan and became quite popular with market participants. In general, those types of charts tend to be similar to the traditional candlestick diagrams, however, there is indeed one big difference between them.
The fact of the matter is that Heiken Ashi charts are constructed in a way to make the latest Forex trend much more visible for traders. This helps to clear out the unnecessary daily noise from the daily market fluctuations and allows traders to focus on the latest trends.
Therefore, it is not surprising that Heiken Ashi charts are very useful tools in the hands of traders in many ways. Besides the obvious benefit of making the identification of trends easier, those types of diagrams can also help traders to identify potential reversals on time and respond to those changes in a timely manner.
It is worth pointing out that the Heiken Ashi charts can certainly make it easier for traders to identify important support and resistance points without necessarily having a deeper understanding of specific candlestick patterns and their dynamics.
Finally, it is important to mention that just like any other Forex indicator the Heiken Ashi charts can not guarantee the 100% rate and taken alone, sometimes can be misleading. Consequently, it is essential to use them with other technical and fundamental indicators as well.
Heiken Ashi Charts Explained
In Japanese, Heiken-Ashi means an average bar. It is very often used by investors to see the real changes happening on the market, without having to focus on details that might be a little confusing for beginners. Many people use it to understand the trends in the market better and predict future prices on the market.
Over the years, it has proved to a very important part of Forex trading. The best thing about the Heiken-Ashi chart is that it makes the regular candlestick charts more readable and understandable for investors, and is especially useful for those who are new to the market. Just by looking at the Heiken-Ashi chart, you will already know the major trends on the market and will have an idea about the situation very easily. This is why so many newcomers use it so actively every day.
It is very important to understand how to predict the trends because it will determine your ability to get profit. The more profit can be generated if you are able to predict the trends correctly in necessary situations. Heiken Ashi charts are very similar to regular candlestick charts, and it is very important to understand the differences between these two to make sure that you can use the one that works better for you. Below, we will discuss this two one-by-one to make sure you understand everything about these two very well.
Candlestick charts
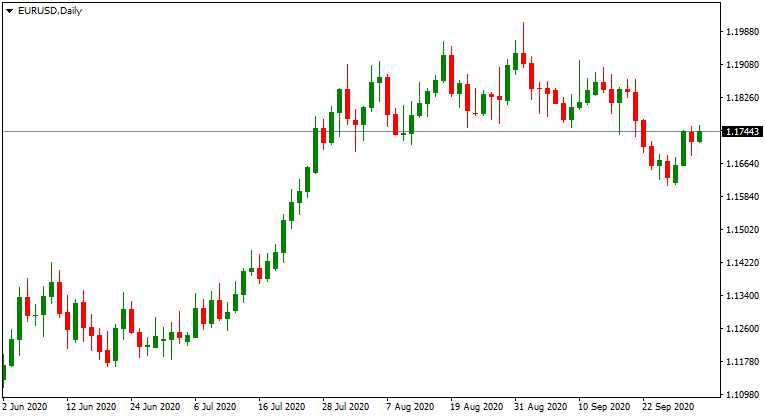
In the picture above, you can see the candlestick chart, which is very detailed and focus on any changes in the market. It is a financial chart that is being used to describe the price movements and changes of securities, derivatives, currencies, etc. They are used to showing exactly how much and when the prices of these assets have changed and can be used by investors to determine what could happen next. The thing about it, however, is that it is a little hard to understand.
Most of the newcomers on the market find it very hard to use these types of charts because they simply do not have enough information about what to focus on. It becomes very hard for them to understand what they should be looking at, and because of that, in many cases, it becomes useless for beginner traders.
Candlestick charts are used by investors to better understand the possible movements on the market based on the patters of the past. They are very useful for investors to understand possible changes in the market since the display information about the details of the trading, such as open, close, the highest point, and lowest point information.
To be able to better understand the pattern, different colors are being used in the chart. For example, a down candle is mostly red, and up candles are mostly green to make it better for investors to see what has changed, and how it has changed.
Heiken Ashi Charts
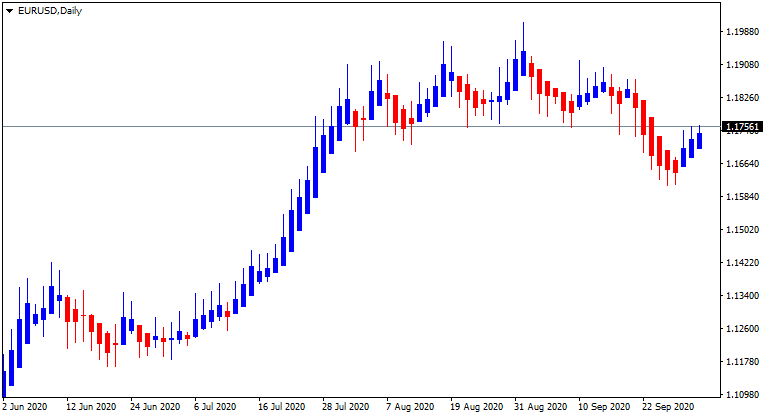
The Heikin-Ashi chart is very much like a regular candlestick chart, and it is constructed just like it. The thing, however, is that the formula to calculate each bar of this chart is very different. Generally, there are many types of charts, in some of them, the down days in the chart are represented by filled candles, and the up days are empty candles. In the above-shown chart, the up days are shown in blue color, and down days are shown in red color. It is also more smooth-looking because it is showing the average of the movements and offers investors the ability to see the average differences.
If you look at the two charts shown above, it is very easy to differentiate them from one another. While the regular candlestick charts largely focus on any type of changes on the market, the Heiken-Ashi mostly focuses on general tendencies and offers investors the ability to very easily understand what is happening on the market by just looking at it. This is why it is very useful to beginners, most of them do not know what information is most important for them, and this chart gives them the general information that is the most important for them.
As the above-shown charts indicate, it is a lot easier for investors to use this type of chart. However, it does not mean that it will work for everyone equally. The thing is, it very much depends on the needs and wants of the investors. Something that works well for you does not mean that it will work just the same way for every other investor on the market. There are many well-experienced investors around the world who prefer using regular candlestick charts only because they offer more detailed information about the market.
On the other hand, however, for those people who do not really know how to use detailed information about the market, the Heiken-Ashi chart is way more useful, because they can very easily, by just looking at the chart, tell what is happening on the market.
Benefits of Using Heiken Ashi Charts
We have already talked about the general information about Heiken-Ashi charts, which is a very popular way of price representation and is being used very actively in the world of finance. Now, we will discuss the benefits that it has in greater detail.
At the first glance, this chart may look very similar to candlesticks charts, however, there are some notable differences between these two, and now, we are going to discuss the biggest advantages that Heiken-Ashi has over more regular charts.
The most obvious difference is the fact that Heiken-Ashi charts are mostly focused on the open-high-low-close. They open in the middle of the previous candle, and the price of it is calculated as the average of the open, high low, and close price of a certain session.
The way they represent ongoing events on the market is helping it to be more smooth to understand and consume by investors. This is very helpful for investors who like to follow trends and understand the obvious price changes in the market.
Another huge advantage that it has is that it is very easy to recognize and understand. Unlike regular candlestick patters, which offer very complicated displays of the market, Heiken-Ashi charts are very easy to understand. While it is not a problem for experienced traders to understand what is shown on the Candlestick patterns, it is something that is considered to be very complicated for beginners on the market. Because of that, many beginners actually prefer using Heiken-Ashi, and not for the wrong reason.
A simple way to get information
The most important part of Heiken Ashi is that it offers traders the ability to get information is a super simple manner, unlike any other chart on the market. These charts are very useful because they offer information that can actually make a change in the market.
What happens for beginner traders, in many cases, is that it is very hard for them to understand the things that are shown in more regular charts, such as, Japanese candlesticks, and since they do not understand the information that is shown there, it becomes useless for them, so, it is very important for beginners to have an opportunity to use a chart that is a lot easier to understand.
Because of this and many other reasons as well, many investors use these types of charts for investments. As we have already said, it might not work for everyone, but for those who it is useful, it can be very rewarding. The thing about the trading world is that not everyone has the same experience and not everyone is looking for the same thing and the fact that they have the ability to choose something that can actually work for them is a very great offering.
The reason for people using this type of chart is very simple. The thing is, it basically filters out a lot of unnecessary information and it becomes a lot easier for every user to understand what actually is happening on the market. Also, the changes in the market can be spotted more accurately, siren it shows very well when the market is growing or is down. It gives investors the ability to follow the trends without having to focus on small details that might not be that important in the long run.
Imperfections of Heiken Ashi Charts
As useful as it might be, for some investors, it is a total no-go. There are many reasons for it, but the most important part is that since it smooths the prices on the market, the information provided by this chart can be a little late for identifying trends and it can become very hard for investors to see what It is actually that they should be looking out for.
This is something that is very much not liked by the investors using Heiken Ashi, because, if you end up getting the information later that you should have, it might end up causing you a lot of loses.
Despite having so many advantages that it has, there still are limitations that investors get while using this chart. The thing is, it does not have problems on its own, but it is less useful in some cases when compared to more traditional and regular Japanese Candlesticks.
Over the years, there have been serval cases when the Japanese Candlesticks have shown a bit more information about the changes in trends on the market. The thing is, there are some traders who want to have access to details, it is very important for them to be able to see everything that happens on the market, and Heiken Ashi chart simply does not offer such a thing.
Many experienced traders, who are more careful about their decisions, focus a lot on the details, and they want to understand why, how, and when exactly it happened. Because of this, it is very important for them to be offered a lot of information about changes, and the fact that something simply changed on one of the days of the year is not enough for them to make final decisions.
These people will not find Heiken Ashi useful, but it in no way means that Heiken Ashi can not be useful at all. As we have already said before, it largely depends on who you are and what it is exactly that you are looking for in the trading market. If you are one of those people who always wish to be up-to-date with the exact information about changes that happen on the market, this chart will simply not work as well as a regular candlestick chart would.
What types of traders will enjoy using Heiken Ashi charts more?
 The experience that you will have with this chart largely depends on the experience that you have with trading. Most of the investors who like to use the Heiken Ashi chart are those who have just started trading and are looking for something that will offer them a very good insight into the market.
However, it does not mean at all that experienced traders will not enjoy using this chart. The thing about it is that it offers investors the ability to quickly and easily get the information that might be very important about trading. This chart works perfectly for those who do not really want to spend a lot of time analyzing and searching for signs.
It offers a very quick overview of the market to traders and will give them the ability to understand what is changing. By using a very simple method, it mostly focuses on the final fact, which is a very important part of decision-making. As some of the research done by the experts of the market indicates, this chart is very useful for everyone who wants to look at something and come up with a decision easily.
It is super easy to use and was created to help investors make final decisions. The thing that is loved about it the most is the fact that it smoothes out everything so that investors do not have to do much more than just looking at it. The information is provided in a very useful manner with the help of this chart, and just by looking at it, you can make decisions about trading.
How does Heiken Ashi chart work?
The main idea behind the Heiken Ashi chart is to offer investors a way to quickly make decisions. It focuses on several parts of trading and is something that can be used by any investor. The name of the chart describes everything about it very easily, if we translate the name from Japanese to English, it basically means the average bar. They are weighted version of candlesticks and are calculated in a very easy way:
- Close = (real open + real high + real low + real close) / 4
- Open = (previous Heikin-Ashi open + previous Heikin-Ashi close) / 2
- High = max(real high, Heikin-Ashi open, Heikin-Ashi close)
- Low = min(real low, Heikin-Ashi open, Heikin-Ashi close)
The thing about the Heiken Ashi candle chart is that it does not always represent the actual open/close, rather, it works on averages to give investors a general idea about the things that are happening on the market. Unlike regular Japanese candlesticks, the long wick mostly shows the strength and gives investors an idea about the ongoing events on the market. This ensures a lot easier chart for readability, and it can be understood very easily by those who do not have much experience in the market.
Using Heiken Ashi chart
Heiken Ashi chart can be used with any market, and it is offered by most of the charting platforms around the world. To use this chart, you do not need to think a lot. It is a very simple procedure and can be done by simply anyone on the market. The great thing is that it is super user-friendly, and does not really need a lot of experience from investors.
To use this chart, you must understand several concepts, however. If the candles are hollow or green, with no lower shadows, it shows that the uptrend is very strong and you can let your profits grow. If the hollo works green candles have some type of a sign of an uptrend, it means that you will have to add to your long positions and it also indicates that it is time for you to exit your short positions.
If the candles have a small body and they also have upper and lower shadows it means that a trend is changing. If you love risks, you make moves, but if you rather avoid risks, you would most likely wait before deciding to make moves. If the candles are red-colored or they are filled, it means that the market is going down. In this scenario, you will have to add to your short position and exit the long position. If the red candles do not have higher shadows it means that the downtrend is very strong and you would be more likely to prefer to stay short until there is some type of change in this trend.
 This type of chart can be very successfully used for analysis and decision-making. They offer a good insight into the market, creating a very good situation for investors. Generally, it is very important for investors to use any type of opportunity that they have for decision-making because it will make trading much easier and rewarding as well.
We have talked about all of the important things about the Heiken Ashi chart. As we have said already, this is a very important indicator for many investors, since it offers them a good insight into the market and the changes that happen on the market. Although there are some investors for whom the offerings of this chart are simply not enough, it can still be very helpful for others on the market.
Over the last few years, this chart has been used by many people around the world. There are many things that make it one of the best charts for a number of investors. The thing about it is that it offers information that can be a lot easier to understand for everyone. No matter how much experience you can have with trading, you can very easily tell what is happening on the market just by looking at this chart.
So, if you are looking for an indicator that can help you more easily make decisions in the world of investments, using this chart is very much recommended.
Guide to Heiken Ashi Charts – Summary
- Heiken Ashi means “average bar” in Japanese, which very well describes the way it works. This chart is very similar to more traditional Japanese candlestick charts, and the main difference is that Heiken Ashi offers more general information about the market
- Heiken Ashi charts offer a smooth overview of the market. Thanks to the fact that the information shown on this chart is smooth, it is very easy for investors to see what is happening in the market
- Heiken Ashi makes it a lot easier for investors to see the real trends on the market and identify the changes that are happening. The process of telling what is happening is very simple, there are two colors, red and green. Red means that there are a downtrend and the green indicates that there is an uptrend
- Although it is very useful, there are some things that some investors might not like. One of them is that because it offers a smooth overview of the market, there are some details that are not shown to investors. This chart offers more general information about the market


Comments (0 comment(s))