Elliott Wave Expanding Triangle Pattern – Everything You Need to Know about It
Table of contents
One of the key characteristics of a global capitalist economic system is that the prices of goods and services are always fluctuating. Whether it’s the economies consolidating and expanding or the inflation levels rising, or the two processes taken together, one can always expect the consumer prices to move up and down all the time.
The same is true for financial trading. Whether you take a look at Forex, stocks, commodities, or just about any other market, you will see that the prices on their intrinsic assets change too, and quite drastically sometimes.
Since the currency exchange market is today’s biggest financial market in the global economy, it has the most number of tools and features that track these price movements, analyze them, and try to predict the upcoming fluctuations. The entire technical analysis and indicators’ thing is dedicated to this purpose and this purpose only.
Besides technical indicators, there are charting mechanisms and patterns, just like the expanding triangle pattern that we’ll talk about in this in-depth guide. Ultimately, all of the above-mentioned analysis mechanisms help traders speculate on the upcoming price changes and open more profitable positions.
Introduction to the Elliott Wave rules
Before we get to the actually explaining the expanding triangles, first, we need to talk about where they originate and how they were conceptualized.
The inception of the triangle patterns is associated with the name of Ralph Nelson Elliott – an American accountant and author that studied the stock market extensively and developed his Wave Principle. So, the first observation is that the Elliott Wave theory of corrective triangles is that they were originally based on a stock market. However, it’s worth mentioning that the focus subject of our article, the expanding triangles, are much more common on the Forex market.
As Elliott believed himself, the market moves were based on deep human psychological impulses and that these impulses caused repetitive cycles on it. According to the Elliott Wave triangle rules, the upward or downward price swings usually occurred in five-wave patterns, which then were followed by the corrective triangle patterns.
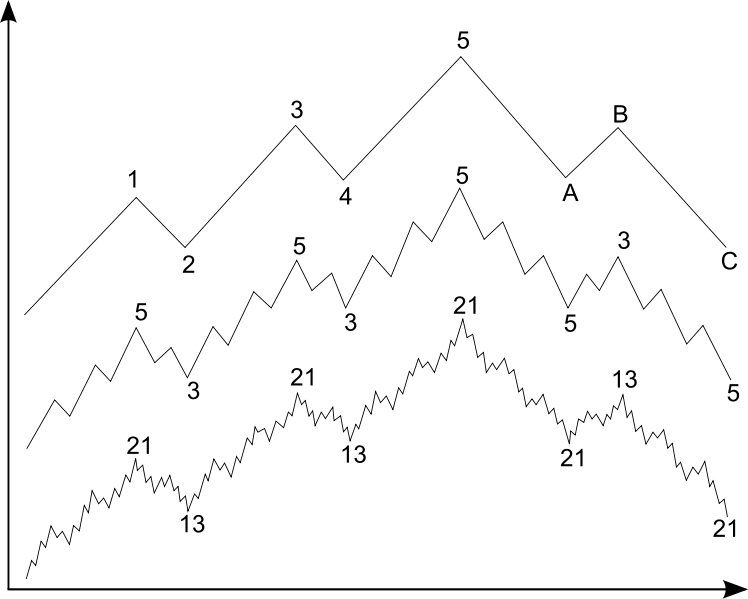
The five-wave pattern was dubbed by Elliott as an impulsive wave, whereas the three-wave patterns were called corrective patterns. So, if the impulsive wave moved in the upward direction in a total of five opposite swings, the corrective pattern would move in the downward direction also in three opposite swings.
Now, this level of simplicity is actually an illusion as Elliott himself has put forward a number of different cycles that interchange between one another. He called the interaction between impulsive and corrective waves a cycle, and in order to extract a plausible technical analysis out of these formations, one has to look at a substantial number of cycles on a chart.
What’s more, a decent Elliott Wave running triangle strategy involves a top-down approach, in which the analysis starts from the monthly, or even a yearly timeframe, and slowly comes down to shorter timeframes of an hourly chart.
Delving into the corrective triangle pattern Forex
Now that we’ve covered the basics of the Elliott Wave theory and the origins of expanding triangle waves, it is time to narrow our focus even further and talk about what the corrective triangle waves are and how they’re formed.
One of the key characteristics of the foreign exchange market is that it tends to get quite volatile on many occasions. However, there are also times when Forex prices consolidate and follow a defined trend in a certain direction.
In the Elliot Wave triangle theory, this consolidation happens through the interchangeability of impulsive and corrective patterns. Every time the price starts to increase or decrease through the impulsive five-wave pattern, the three-wave corrective triangle will kick in and pull the price back, making the whole movement more stable in the long run.
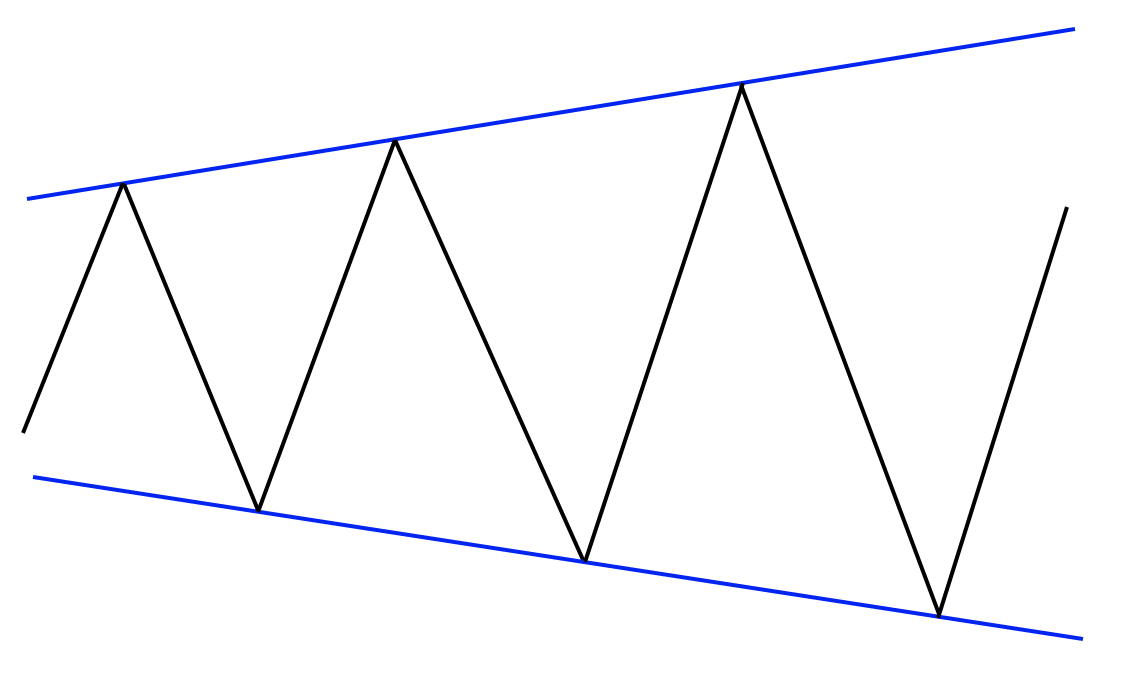
The main way markets consolidate is through triangles. Within the theory of the Elliot Wave, triangle patterns have three waves. However, the entire structure consists of five separate legs, which are labeled with alphabetical letters: a, b, c, d, and e.
Detecting a triangular pattern in a chart is pretty straightforward: you just have to look for the sequence of three consecutive highs and lows; these can be higher-highs and lower-lows or lower-highs and higher-lows, depending on which type of Elliot Wave charts we’re looking at.
Another crucial step in identifying a corrective triangle pattern is to have two separate trendlines drawn in the chart. These trendlines must connect the ends of a-, c-, and e-waves, as well as the ends of b- and d-waves.
The two types of triangle patterns are differentiated by the direction of these two trendlines. If the trendlines are moving closer to each other towards one common point, then we’re going to get a contracting triangle, whereas the trendlines that move apart from each other form an expanding triangle wave.
So, to repeat it once again, there are two main types of corrective triangles within the Elliot Wave theory:
- Contracting
- Expanding
A word about contracting triangles
When it comes to contracting triangles, they’re different from an expanding triangle Elliott Wave in a sense that they form much more frequently than their counterparts. In fact, an average chart with any given timeframe will probably show at least one contracting triangle. As noted earlier, the contracting triangle pops up when the two trendlines connecting a-c-e and b-d points come closer together.
What this means is that the asset price becomes less and less volatile over time and it continuously posts lower highs and higher lows. This specific pattern usually forms before the major economic releases or other important anticipated events, when the suspense is really high and everyone is waiting for a major announcement.
As that announcement is made, the low volatility levels are instantly changed and the contracting triangle breaks higher or lower of the pre-determined trendline. This basically happens after almost every stabilization period: the asset volatility is constantly decreasing to the point where the price breaks with a major increase or decrease.
Expanding triangle pattern Forex guide
So, it’s now finally time to talk about the Elliott Wave expanding triangle pattern and see what significance it has in the Forex trading process.
As pointed out earlier in the description, expanding triangles form less frequently than contracting triangles, and that has something to do with the vicious nature of this pattern. However, it is worth mentioning that it forms way often on the foreign exchange market than on other markets.
So, what is an expanding triangle pattern? As the Elliott Wave theory explains, there will be certain times when the price fluctuations in the corrective patterns are exceptionally intense. Moreover, each individual leg is larger than the previous one, forming an expanding structure within the chart.
Now, when an expanding triangle occurs, it sends out contradictory signals to traders, which leads them to make faulty decisions and be ejected from the trade. Here’s a pretty likely scenario related to the expanding triangle trading:
Let’s say you see the a- and b- waves already forming and the b-wave is more predominant than the a-wave. The first immediate response you would have is to rush and open a position in the direction of a b-wave, while placing the stop-loss at the beginning of it.
Now, as the rule of expanding triangles maintains, the next c-wave is going to be even more dominant than the b-wave, and it’ll go in the opposite direction. What this means is that not only will your position go against you, but it’ll go over the pre-selected stop-loss and get you out of the trade.
But that’s not where things stop. As you learn your lesson, other traders will come in the picture, “riding” the c-wave direction and placing the stop-loss at the beginning of it. In a very short time, the new d-wave starts to kick in with the opposite direction. And as it goes past the lowest-low of the c-wave, it’ll activate the stop-loss and eject the traders from the market.
This is basically the usual outcome when the expanding triangle chart pattern occurs. And as the final e-wave starts to break in the opposite direction, traders’ minds are already all over the place, not knowing what is going on with the prices or whether they’ll ever stabilize in a definite trend. This will usually withhold them from opening a new trade, failing to recognize the expanding wave pattern in the first place, and being blinded by this illusion that the e-wave will never end. And while this is certainly a myth and the price will definitely break from the e-wave, the vicious fluctuations before will prevent people from seeing that.
Three main patterns used in the expanding triangle technical analysis
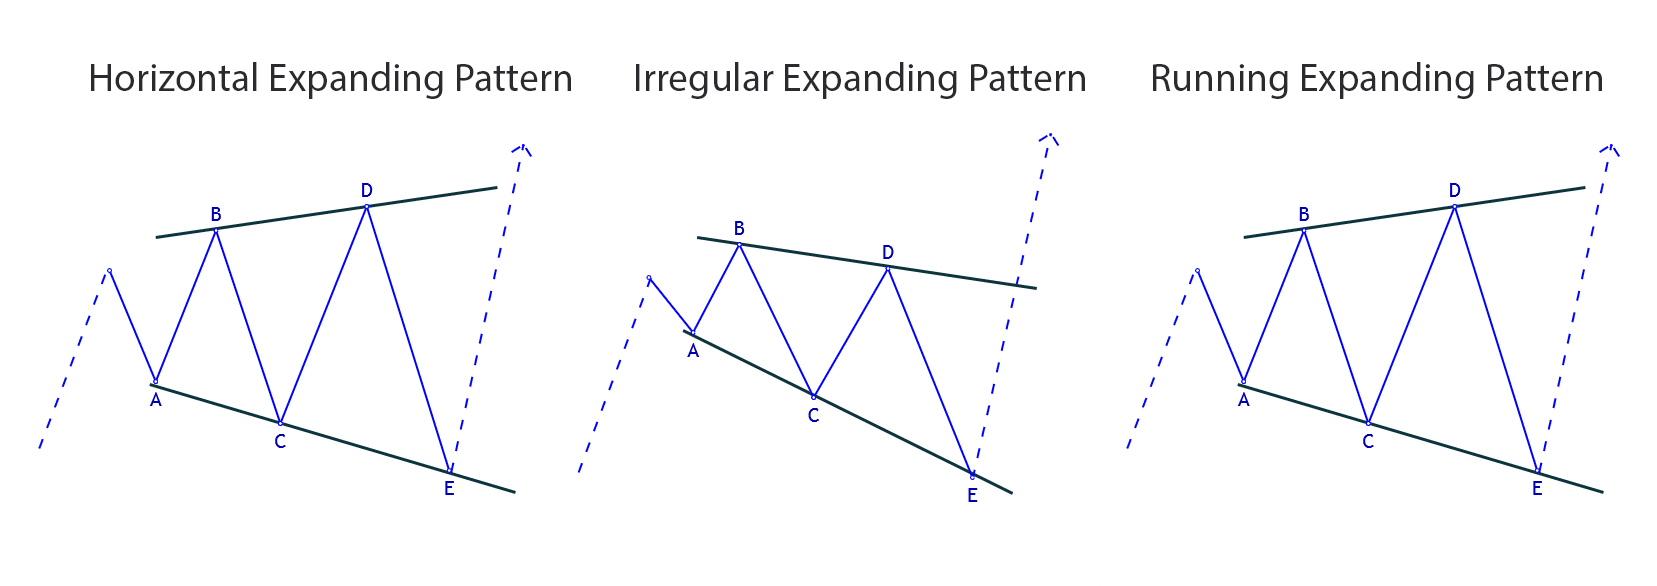
Now, the categorization of Elliott Wave triangle patterns still doesn’t end here. Even the expanding triangles have their own sub-types that differ from one another in terms of their specific formations. In this guide, we’ll talk about three different types of a rising triangle pattern:
- Horizontal expanding triangle
- Irregular expanding triangle
- Running expanding triangle
Horizontal expanding triangle
Out of all existing expanding triangle patterns, the horizontal expanding triangle is the rarest form that can form in the chart. The main reason for it is the pattern’s ideally-expanding individual waves:
The horizontal expanding triangle has every next wave larger than the previous one, just like we said when explaining the basics of expanding triangles. And, it goes without saying that such fluctuations are the most damaging of all. They occur when the overwhelming period of uncertainty dawns upon the financial market; when people don’t really know what the next price movement will be and the current price swings are led by fake incentives.
Irregular expanding triangle
As the name of this triangle pattern suggests, the formation of an irregular expanding triangle will include some sort of unexpected patterns. And fairly enough, there is an irregularity here: instead of every single wave being larger than the previous one, the b-wave will be significantly smaller than all other waves, including the initial a-wave.
In a comparison between the horizontal and irregular Elliott Wave triangle patterns, the irregular one is more common as it’s not as ideally layered as its counterpart. Plus, the fact that the b-wave is smaller makes it easier to see the expansion of the two trendlines more clearly – the degree of the b-d trendline is more acute.
Running expanding triangle
The final expanding wave pattern in the Elliott Wave theory is the running expanding triangle. This is the most abnormal form of a triangle that can be seen in the chart, however, it is the most common to occur at the same time, which is why it is important to understand the key characteristics of this pattern.
So, what does the running expanding triangle look like? Well, just like in the irregular expanding triangle, here the b-wave is also the smallest one of all. Then there is a c-wave that is bigger than the d-wave, and the e-wave that is again bigger than the d-wave. On paper, this looks a little complicated, but in reality, it’s quite useful and easily-understandable:
Whenever a running rising triangle stock pattern (or any other market-related pattern) forms, you should expect that every single triangle will end below or above the previous one. And the exact formation will depend on whether the triangle is bearish (below) or bullish (above). Knowing that such a pattern can actually occur and then it’ll break in a major way, a trader can obtain a huge advantage over others.
Trading with an expanding triangle Forex
So, it goes without saying that expanding triangles are quite useful in trading Forex, as well as other financial markets. According to InvestoRunner, expanding triangles occur in about 5-10% of all trading charts. As we have discovered, the original discoverer of these patterns, Ralph Nelson Elliott has conceptualized the idea that the markets undergo regular cycles of impulsive and corrective patterns that ultimately stabilize the market, although there are quite significant breaks as well.
Elliott’s expanding triangle continuation pattern is a chart movement that sees the asset prices getting farther apart from one another. It consists of five individual legs and three consecutive triangles. A basic description of this pattern is that each wave is larger than the previous one, which creates continuous expansion and high volatility levels.
But we actually found three types of expanding triangles, some of which don’t exactly fit in this description. The first one, the horizontal expanding triangle, repeats the exact same movement where every new price wave is larger than the previous one. Although, the irregular expanding triangle has the b-wave smaller than all other waves, whereas the running expanding triangle has the b-wave smaller than the a-wave, d-wave smaller than the c-wave, and the e-wave larger than the d-wave.
Ultimately, being able to detect expanding triangles on a chart allows you to get ready for a new price breakout that will provide major chances to your position.


Comments (0 comment(s))