How to Use Patterns to Trade the Forex Markets
The capital markets rise and fall with market sentiment, trending and then consolidated as supply and demand change market flows. As the markets move from trending in one direction to consolidation, patterns form. These patterns are recognizable. Generally, there are two different categories of patterns that arise when the market is consolidating. There are consolidation patterns that are continuation patterns, and there are consolidation patterns that are reversal patterns.
What is a Continuation Pattern?
A continuation pattern is a consolidation that is a pause in a trend that refreshes higher or lower depending on the direction of the trend. The two most common continuation patterns are flags and pennants. Both patterns occur after a large rise or fall in the price of an asset. There is a minor difference between a pennant and a flag. The differences occur in the mid-section of the chart of these two patterns.
What are Pennant and Flag Pattern?
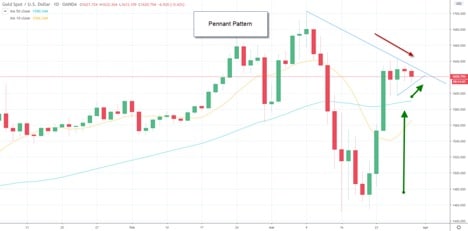
A pennant pattern is a continuation pattern that is a pause that refreshes after a sharp move higher in the price of an asset. In the chart of gold, the price surged and then started to form a consolidation zone. After a period of consolidation, the pennant and flag pattern begin to move again in the direction of the trend.
When looking at a pennant you can see that the middle section of the pattern has converging trendlines. As you can see the upper trend line in the pennant is moving lower and the lower trend line is moving higher. This is a bullish pennant pattern. The main difference between a pennant pattern and a flat pattern is the trend lines. While a pennant pattern has converging trend lines, a flag pattern forms a channel that is not converging.
A bearish pennant or flag pattern would follow a large move lower in price action. Prices decline sharply and then begin to consolidate. After a period of consolidation, the bearish flag and pennant resume their trend lower.
Reversal Patterns
A reversal pattern generally comes at the end of a trend. There are several different reversal patterns such as the head and shoulder pattern and the reverse head and shoulder pattern. The head and shoulder pattern can take a while to unfold.
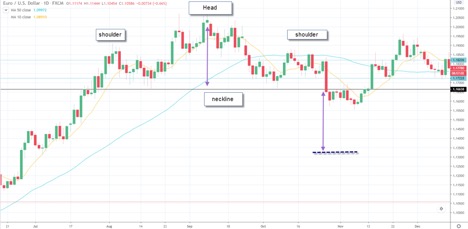
First, the left shoulder is formed as prices rise on heavy volume to the highs for the trend. After making a new high, prices pull back and consolidate. The support on the left shoulder forms the neckline of the head and shoulder pattern. After moving sideways prices then begin to form a head pattern. The movement to new highs for the trend is accompanied by robust volume. After the move higher prices pull back and then consolidate forming the rest of the head.
Support is seen at the neckline. After moving sideways prices again attempt to move higher but this time, they are unable to make fresh highs. The right shoulder is generally formed with lower trading volume. Prices will consolidate at the neckline and then break through this level of support on heavy volume. Your take profit target can be calculated by using the difference between the head and the neckline.
Bottom Line
You can use several different patterns to help you determine the future movements of assets. You can use online trading tools such as charts and graphs to help you find a pattern within the different assets that you trade. Before you begin to trade using continuation or reversal patterns, make sure you determine the appropriate risk management to use to cap your risk with pattern recognition strategies.


Comments (0 comment(s))